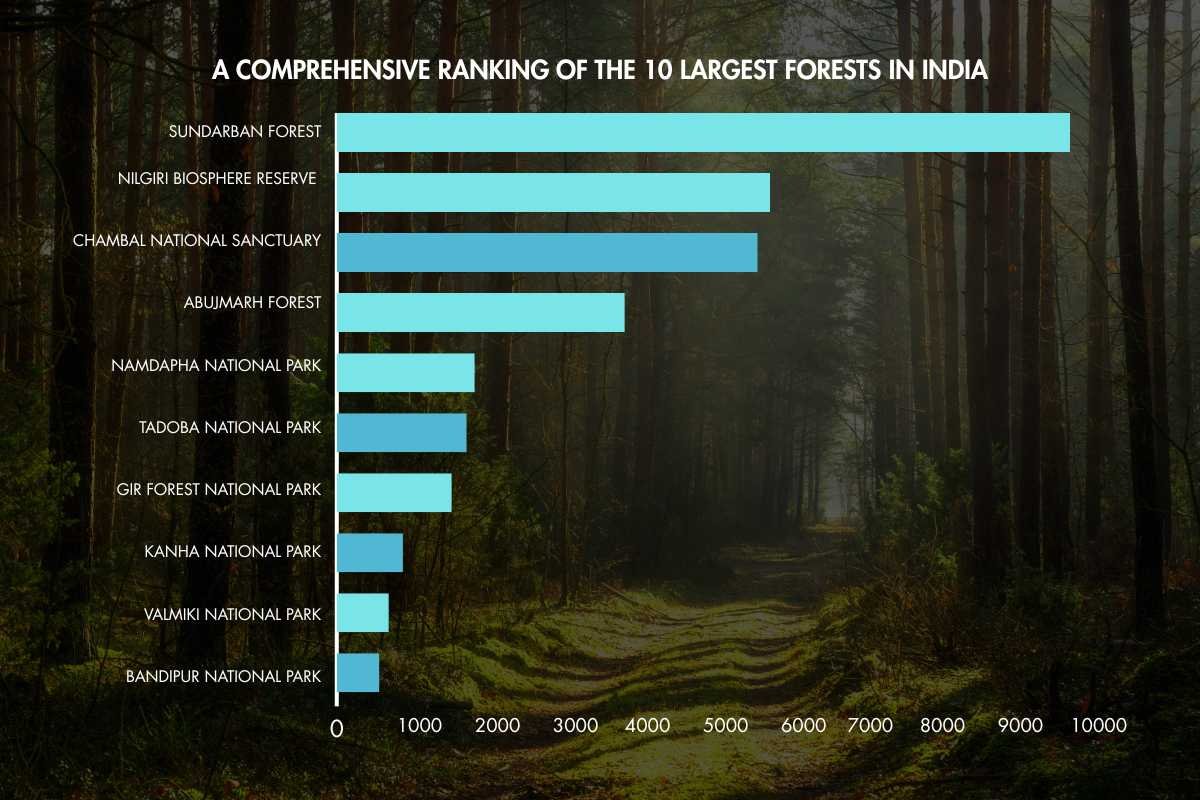
In today’s digital landscape, capturing and retaining audience attention is more challenging than ever. As content creators, we are continually exploring innovative ways to engage our audience. One powerful tool that has gained immense popularity is infographics. Creating infographics for engagement not only simplifies complex information but also makes it visually appealing and easy to digest. In this article, we will explore the significance of infographics, how to create them effectively, and tips for maximizing engagement, specifically catering to the Indian audience.
The Importance of Infographics
Infographics serve as a bridge between information and visual communication. They provide a unique way to present data, statistics, and processes through graphics, which can be particularly effective in a country as diverse as India. Here are a few reasons why creating infographics for engagement is crucial:
- Visual Learning: Studies show that people remember information better when it’s presented visually. In India, where literacy rates vary and different languages are spoken, infographics can transcend language barriers, making information accessible to a broader audience.
- Increased Shareability: Infographics are highly shareable on social media platforms, which are widely used across India. They encourage sharing and can quickly go viral, increasing brand visibility and reach.
- Simplification of Complex Information: In sectors like healthcare, education, and technology, information can often be complex. Creating infographics for engagement helps break down this complexity into digestible bits, allowing the audience to grasp the key points quickly.
Steps to Create Engaging Infographics
1. Define Your Audience
Before diving into the design process, it’s essential to understand your target audience. In India, demographics can vary significantly. Identify who your audience is—consider factors like age, location, and interests. Tailoring your infographics to resonate with your audience will enhance their effectiveness.
2. Choose a Relevant Topic

Select a topic that is relevant to your audience and aligns with your brand’s goals. Topics that address common challenges, share insightful statistics, or highlight cultural elements tend to perform well. For instance, an infographic showcasing the impact of pollution in major Indian cities could resonate with environmentally conscious individuals.
3. Gather and Analyze Data
Once you have a topic in mind, gather credible data and statistics. Ensure your sources are reliable; using data from governmental reports, academic studies, or reputable organizations enhances your infographic’s credibility. In India, referencing local studies or data can significantly boost engagement, as audiences appreciate relatable information.
4. Select the Right Tools
Several online tools facilitate the creation of infographics, such as Canva, Piktochart, and Visme. These platforms offer user-friendly interfaces and a plethora of templates tailored for various themes. Choose a tool that aligns with your skill level and design needs.
5. Focus on Design Principles

When creating infographics for engagement, design is crucial. Here are some design principles to keep in mind:
- Color Schemes: Use colors that resonate with your audience. In India, colors have cultural significance, so consider incorporating traditional colors or palettes that evoke positive emotions.
- Typography: Select fonts that are easy to read. Avoid using more than two different fonts to maintain a clean look.
- Visual Hierarchy: Ensure that the most critical information stands out. Use larger fonts or bolder colors for headlines and key data points.
- Graphics and Icons: Incorporate relevant graphics, icons, and images. They not only enhance aesthetics but also help convey messages more effectively.
6. Craft Compelling Content
Your infographic should contain succinct and impactful text. Use short sentences and bullet points to convey information. Ensure your content flows logically, guiding the audience through the information seamlessly. This clarity is vital for maintaining engagement.
7. Optimize for SEO
For your infographic to reach a broader audience, it’s crucial to optimize it for search engines. Use relevant keywords, such as “creating infographics for engagement,” in the title, descriptions, and image alt texts. This optimization helps your infographic rank better in search results, attracting more viewers.
8. Promote Your Infographic

After creating your infographic, share it across various platforms. Utilize social media channels popular in India, such as Facebook, Instagram, and WhatsApp, to promote your work. Consider reaching out to influencers or blogs relevant to your niche to broaden your audience.
9. Encourage Interaction
Encourage your audience to engage with your infographic. Ask questions, encourage comments, and create shareable formats that allow users to contribute their perspectives. This interaction can enhance engagement and foster a sense of community around your content.
Measuring Success
Once your infographic is live, it’s essential to measure its performance. Track metrics such as shares, likes, comments, and website traffic to gauge engagement levels. Tools like Google Analytics and social media insights can provide valuable data on how well your infographic resonates with the audience.
Conclusion
In a content-saturated world, creating infographics for engagement stands out as an effective strategy to captivate and inform your audience. By understanding your audience, focusing on design, optimizing for SEO, and encouraging interaction, you can significantly enhance the effectiveness of your infographics. For the Indian audience, infographics offer a unique way to present valuable information while respecting cultural nuances and promoting accessibility.
As you embark on your infographic creation journey, remember that the ultimate goal is to inform, engage, and connect with your audience. With creativity and a strategic approach, your infographics can leave a lasting impact, sparking conversations and driving engagement in your niche.
Did you find this article helpful? Visit more of our blogs! Business Viewpoint Magazine


